Consider the clustered bar chart of the dashboard developed to monitor the performance of a call center: 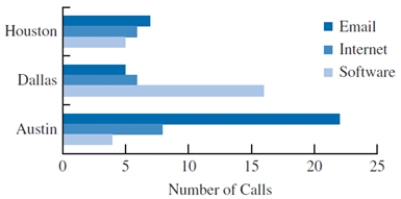 This chart allows the IT manager to
A) identify a particular type of problem by the call volume.
B) identify a particular type of problem by location.
C) identify different types of problems (Email, Internet, or Software) in the call center.
D) identify the frequency of each problem in the call center.
Correct Answer:
Verified
Q1: The charts that are helpful in making
Q3: A time series plot is also known
Q8: A _ is a line that provides
Q12: Data-ink is the ink used in a
Q20: The following image is a
Q21: We create multiple dashboards
A)to help the user
Q24: The following table is an example
Q25: A data visualization tool that updates in
Q36: A _ is used for examining data
Q38: A two-dimensional graph representing the data using
Unlock this Answer For Free Now!
View this answer and more for free by performing one of the following actions

Scan the QR code to install the App and get 2 free unlocks

Unlock quizzes for free by uploading documents