The scatter chart below displays the residuals verses the dependent variable, x. Which of the following conclusions can be drawn based upon this scatter chart? 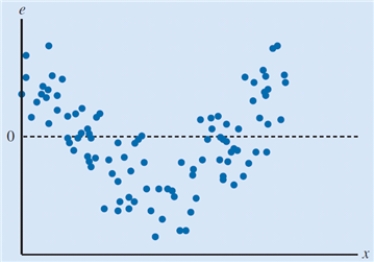
A) The residuals have a constant variance.
B) The model fails to capture the relationship between the variables accurately.
C) The model over predicts the value of the dependent variable for small values and large values of the independent variable.
D) The residuals are normally distributed.
Correct Answer:
Verified
Q23: The prespecified value of the independent variable
Q24: The degree of correlation among independent variables
Q25: A variable used to model the effect
Q32: The coefficient of determination
A)takes values between -1
Q39: The _ is an indication of how
Q39: A normally distributed error term with mean
Q40: The scatter chart below displays the residuals
Q41: Listed below is a company's sales
Q42: Listed below is data on profit
Q43: Listed below is a company's sales
Unlock this Answer For Free Now!
View this answer and more for free by performing one of the following actions

Scan the QR code to install the App and get 2 free unlocks

Unlock quizzes for free by uploading documents