The scatter chart below displays the residuals verses the dependent variable, t. Which of the following conclusions can be drawn based upon this scatter chart? 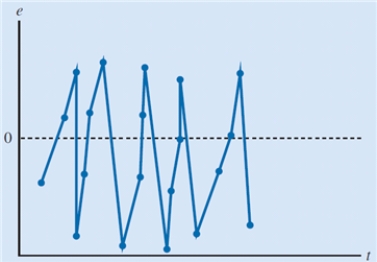
A) model is time-invariant.
B) model captures the relationship between the variables accurately.
C) residuals are not independent.
D) residuals are normally distributed.
Correct Answer:
Verified
Q21: A variable used to model the effect
Q25: A variable used to model the effect
Q27: The scatter chart below displays the residuals
Q28: The process of making estimates and drawing
Q29: The process of making conjecture about the
Q31: _ is used to test the hypothesis
Q32: Which of the following regression models is
Q37: _ refers to the use of sample
Q38: What would be the coefficient of determination
Q40: _ refers to the degree of correlation
Unlock this Answer For Free Now!
View this answer and more for free by performing one of the following actions

Scan the QR code to install the App and get 2 free unlocks

Unlock quizzes for free by uploading documents