A time series plot of a period of time period (quarterly) verses quarterly sales (in $1,000s) is shown below. Which of the following data patterns best describes the scenario shown? 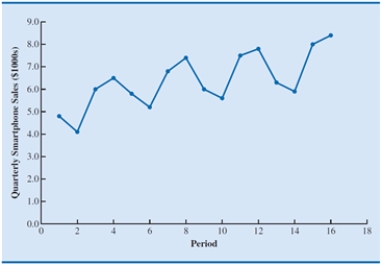
A) Linear trend and cyclical pattern
B) Linear trend and horizontal pattern
C) Seasonal and cyclical patterns
D) Seasonal pattern and linear trend
Correct Answer:
Verified
Q2: A time series plot of a period
Q2: Trend refers to
A)the long-run shift or movement
Q8: _ is the amount by which the
Q8: A time series plot of a period
Q10: Which is not true regarding trend patterns?
A)Can
Q11: If a time series plot exhibits a
Q12: The mean absolute error, mean squared error,
Q13: Which of the following states the objective
Q18: Which of the following is not true
Q20: If the forecasted value of the time
Unlock this Answer For Free Now!
View this answer and more for free by performing one of the following actions

Scan the QR code to install the App and get 2 free unlocks

Unlock quizzes for free by uploading documents