Using the graph below, which of the following is true of the above function? 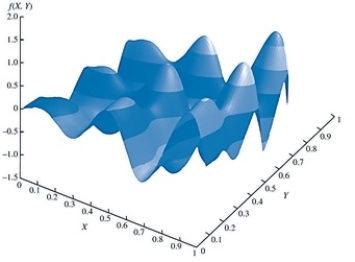
A) It has single local minimum.
B) It has multiple local optima.
C) It has single local maximum.
D) It has no maxima and minima.
Correct Answer:
Verified
Q14: A feasible solution is a local minimum
Q21: In the Bass forecasting model, the _
Q23: The measure of risk most often associated
Q23: Using the graph below, the feasible region
Q28: Which of the following is a second
Q29: In the Bass forecasting model, the _
Q30: The _ option in Excel Solver is
Q31: The _ forecasting model uses nonlinear optimization
Q33: If the portfolio variance were equal to
Q39: Excel Solver's _ is based on a
Unlock this Answer For Free Now!
View this answer and more for free by performing one of the following actions

Scan the QR code to install the App and get 2 free unlocks

Unlock quizzes for free by uploading documents