Figure 21-2.The graph shows two budget constraints for a consumer. 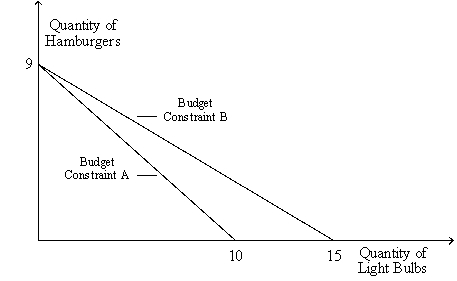
-Refer to Figure 21-2.Suppose the price of a light bulb is $3 and Budget Constraint B applies.What is the consumer's income? What is the price of a hamburger?
Correct Answer:
Verified
View Answer
Unlock this answer now
Get Access to more Verified Answers free of charge
Q65: A consumer's budget constraint is drawn with
Q67: When we draw Katie's indifference curves to
Q75: The rate at which a consumer is
Q462: Figure 21-1.The figure shows three indifference curves
Q465: Figure 21-1.The figure shows three indifference curves
Q466: Figure 21-1.The figure shows three indifference curves
Q468: Figure 21-1.The figure shows three indifference curves
Q469: Figure 21-2.The graph shows two budget constraints
Q470: Figure 21-1.The figure shows three indifference curves
Q471: Figure 21-1.The figure shows three indifference curves
Unlock this Answer For Free Now!
View this answer and more for free by performing one of the following actions

Scan the QR code to install the App and get 2 free unlocks

Unlock quizzes for free by uploading documents