The figure given below depicts long-run equilibrium in the aggregate demand-aggregate supply model.The movement from Y1 to Y2in this figure could have been caused by a: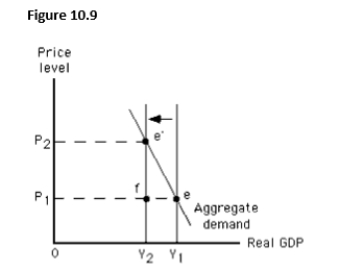
A) decrease in the size of the labor force.
B) decrease in the price level.
C) positive level of net investment.
D) increase in autonomous consumption.
E) decrease in autonomous consumption.
Correct Answer:
Verified
Q135: Stagflation is defined as:
A)decreased output accompanied by
Q136: The short-run equilibrium output in the economy
Q137: If global pollution causes climatic changes that
Q138: An adverse supply shock would shift:
A)only the
Q139: In the figure given below,when aggregate supply
Q141: The international oil price hike by OPEC
Q142: If the rate of increase in the
Q143: If the price level increases by 5
Q144: During a particular year,nominal wages increased by
Q145: The longer the unemployment rate remains above
Unlock this Answer For Free Now!
View this answer and more for free by performing one of the following actions

Scan the QR code to install the App and get 2 free unlocks

Unlock quizzes for free by uploading documents