The figure given below depicts long-run equilibrium in the aggregate demand-aggregate supply model.Which of the following changes is depicted by the movement from Y1 to Y2?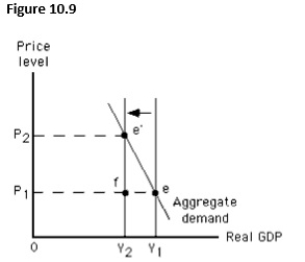
A) An increase in long-run aggregate supply
B) An increase in short-run aggregate supply
C) A decrease in short-run aggregate supply
D) A decrease in long-run aggregate supply
E) An increase in the aggregate quantity demanded
Correct Answer:
Verified
Q129: In the long run,the price level is
Q130: If the actual price level is lower
Q131: Workers usually negotiate compensation in terms of
Q132: Given a downward-sloping aggregate demand curve,if short-run
Q133: The nominal cost per unit of output
Q135: Stagflation is defined as:
A)decreased output accompanied by
Q136: The short-run equilibrium output in the economy
Q137: If global pollution causes climatic changes that
Q138: An adverse supply shock would shift:
A)only the
Q139: In the figure given below,when aggregate supply
Unlock this Answer For Free Now!
View this answer and more for free by performing one of the following actions

Scan the QR code to install the App and get 2 free unlocks

Unlock quizzes for free by uploading documents