The figure below shows equilibrium in an aggregate demand-aggregate supply model.Which of these statements is true if the economy described by this figure is at point M on SRAS100?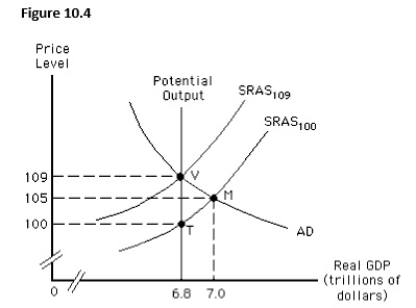
A) The actual price level is lower than expected with a $200 billion expansionary gap.
B) The actual price level is lower than expected with a $200 billion recessionary gap.
C) The actual price level is higher than expected with a $200 billion recessionary gap.
D) The actual price level is higher than expected with a $200 billion expansionary gap.
E) The economy is in equilibrium in the short run and the long run.
Correct Answer:
Verified
Q60: In the short run,there is a positive
Q61: The figure below shows short-run equilibrium in
Q62: An expansionary gap is closed in the
Q63: The figure below shows short-run equilibrium in
Q64: Which of the following occurs when an
Q66: If resource suppliers and demanders find out
Q67: If the expected price level exceeds the
Q68: The figure below shows the short-run aggregate
Q69: The figure below shows the equilibrium in
Q70: The figure below shows equilibrium in an
Unlock this Answer For Free Now!
View this answer and more for free by performing one of the following actions

Scan the QR code to install the App and get 2 free unlocks

Unlock quizzes for free by uploading documents