The figure below shows the short-run aggregate demand and supply curves of an economy.If the economy is currently producing at Y2,long-run equilibrium will most likely be established by a(n) :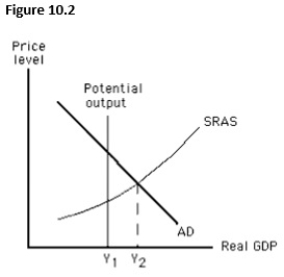
A) increase in short-run aggregate supply.
B) decrease in short-run aggregate supply.
C) decrease in potential output.
D) increase in potential output.
E) rightward shift of the aggregate demand curve.
Correct Answer:
Verified
Q41: Consider schedule #1 in the aggregate
Q42: The figure below shows the short-run aggregate
Q43: Which of the following explains the shape
Q44: Suppose the actual and expected price levels
Q45: For the aggregate demand and aggregate
Q47: The figure below shows the short-run aggregate
Q48: An expansionary gap in the short-run results
Q49: In the aggregate demand-aggregate supply model,which of
Q50: Suppose the actual and expected price levels
Q51: The figure below shows the short-run aggregate
Unlock this Answer For Free Now!
View this answer and more for free by performing one of the following actions

Scan the QR code to install the App and get 2 free unlocks

Unlock quizzes for free by uploading documents