Multiple Choice
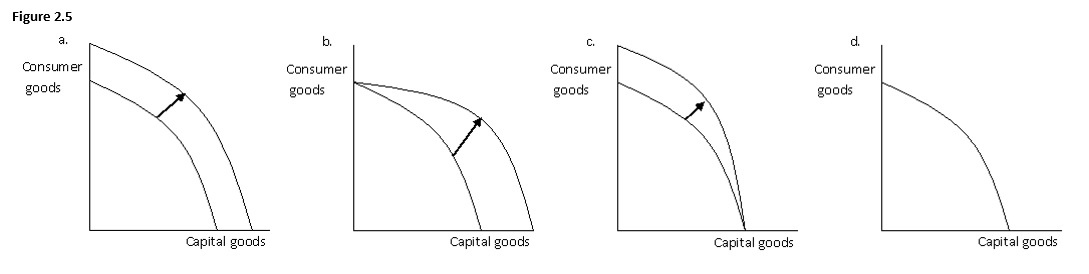
-The following figure has four graphs showing the production possibilities frontier for capital goods and consumer goods.Which of the graphs below best illustrates the impact on the production possibilities frontier of a technological improvement that will make the resources used to produce consumer goods more efficient?
A) a.
B) b.
C) c
D) d
Correct Answer:
Verified
Related Questions
Q16: A rational decision maker engages in an
Q114: A major distinguishing feature between capitalist and
Q117: An improvement in technology used to produce
Unlock this Answer For Free Now!
View this answer and more for free by performing one of the following actions

Scan the QR code to install the App and get 2 free unlocks

Unlock quizzes for free by uploading documents