The normal distribution curve which models, distributions of data in a wide range of applications, is given by the function
where and and are constants called the standard deviation and the mean, respectively. Its graph is shown in the figure. 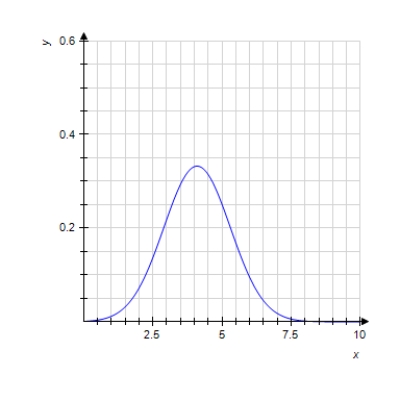 ?
?
In a survey, consumers were asked to rate a new toothpaste on a scale of 1-10. The resulting data are modeled by a normal distribution with and . The percentage of consumers who gave the toothpaste a score between a and b on the section is given by
Use a Riemann sum with n = 10 to estimate the percentage of customers who rated the toothpaste 5 or higher. (Use the range 4.5 to 10.5.) Round your answer to the nearest whole number.
A) 45%
B) 46%
C) 47%
D) 48%
E) 49%
Correct Answer:
Verified
Q20: Evaluate the integral.
Q21: The rate of change
Q22: Calculate the left Riemann sums for
Q23: Decide on what substitution to use,
Q24: Calculate the Riemann Sum for the
Q26: Evaluate the given integral using the
Q27: Calculate the Riemann Sum for the
Q28: Evaluate the integral.
Q29: The graph of the derivative
Q30: The marginal cost function for the
Unlock this Answer For Free Now!
View this answer and more for free by performing one of the following actions

Scan the QR code to install the App and get 2 free unlocks

Unlock quizzes for free by uploading documents