Which graph best describes how the vapor pressure of a solution varies according to Raoult's law as a nonvolatile solute is added to a liquid? The vapor pressure of the solution is plotted on the y-axis, and the mole fraction of solvent is plotted on the x-axis. The origin (0, 0) is not necessarily located where the axes cross. 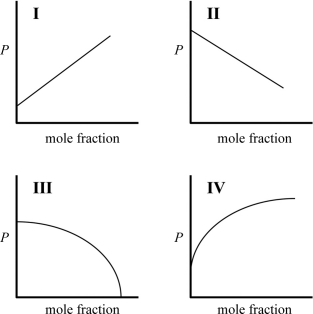
A) I
B) II
C) III
D) IV
Correct Answer:
Verified
Q13: A solution is prepared by adding 0.300
Q14: In the diagram below, one beaker contains
Q16: Which statement about how the vapor
Q17: Which of the solutions shown here will
Q18: Which statement about the vapor pressure of
Q19: In the diagram below, one beaker contains
Q20: Which of the solutions shown here will
Q45: Indicate which aqueous solution has the highest
Q50: Which statement below regarding vapor pressure is
Q54: Which intermolecular interactions are likely to result
Unlock this Answer For Free Now!
View this answer and more for free by performing one of the following actions

Scan the QR code to install the App and get 2 free unlocks

Unlock quizzes for free by uploading documents