Here is a scatterplot of weight versus height for students in an introductory statistics class.The men are coded as '1' and appear as circles in the scatterplot; the women are coded as '2' and appear as squares in the scatterplot. 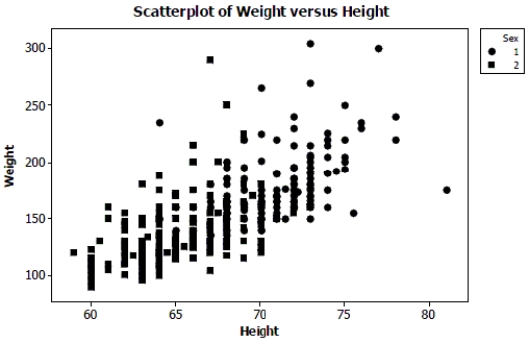
a. Do you think there is a clear pattern? Describe the association between weight and height.
b. Comment on any differences you see between men and women in the plot.
c. Do you think a linear model from the set of all data could accurately predict the weight of a student with height 70 inches? Explain.
Correct Answer:
Verified
View Answer
Unlock this answer now
Get Access to more Verified Answers free of charge
Q6: Interpret the intercept of your model in
Q99: In an effort to decide if
Q100: In an effort to decide if
Q101: A researcher notes that there is a
Q102: Match the following descriptions with the most
Q103: Halloween is a fun night. It
Q105: The following scatterplot shows the relationship between
Q106: During a science lab, students heated
Q108: The average movie ticket prices in
Q109: During a science lab, students heated
Unlock this Answer For Free Now!
View this answer and more for free by performing one of the following actions

Scan the QR code to install the App and get 2 free unlocks

Unlock quizzes for free by uploading documents