Maple trees A forester would like to know how big a maple tree might be at age 50 years.
She gathers data from some trees that have been cut down, and plots the diameters (in
inches) of the trees against their ages (in years). First she makes a linear model. The scatterplot and residuals plot are shown. 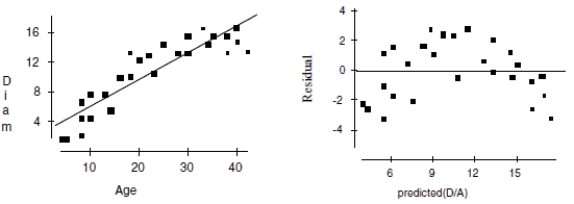
a. Describe the association shown in the scatterplot.
b. Do you think the linear model is appropriate? Explain.
c. If she uses this model to try to predict the diameter of a 50-year old maple tree, would you expect that estimate to be fairly accurate, too low, or too high? Explain.
Now she re-expresses the data, using the logarithm of age to try to predict the diameter of the tree. Here are the regression analysis and the residuals plot.
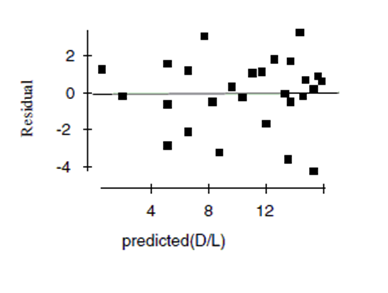
d. Explain why you think this is a better model.
e. Using this model, predict the diameter of a maple tree at age 50 years.
Correct Answer:
Verified
View Answer
Unlock this answer now
Get Access to more Verified Answers free of charge
Q43: After conducting a marketing study to see
Q44: An article in the Journal of
Q45: A scatterplot of log(Y) vs. log(X) reveals
Q46: Using the equation in number #8 again,
Q47: Breaking strength A company manufactures
Q49: A silly psychology student gathers data on
Q50: High Score The longer you play
Q51: A study examined the number of
Q52: The following is a scatterplot of the
Q53: During a science lab, students heated
Unlock this Answer For Free Now!
View this answer and more for free by performing one of the following actions

Scan the QR code to install the App and get 2 free unlocks

Unlock quizzes for free by uploading documents