The following table shows the median age of automobiles and trucks on the road for a certain country. Use linear regression to find the linear equation that is the best fit for the data, with x equal to the number of years past 1980. 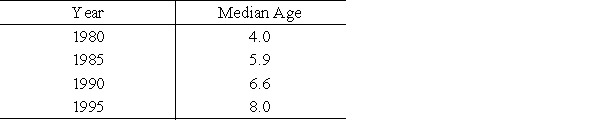
A) 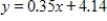
B) 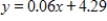
C) 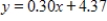
D) 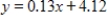
E) 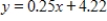
Correct Answer:
Verified
Q79: Suppose that the production function for a
Q80: The demand functions for Q81: Suppose that Q82: A company manufactures two products, A and Q83: Suppose that the following table shows the Q85: Test for relative maximum and minimum. Q86: Test for relative maximum and minimum. Q87: Test for relative maximum and minimum. Q88: Suppose that x units of one input Q89: Suppose that the following table shows the![]()
![]()
Unlock this Answer For Free Now!
View this answer and more for free by performing one of the following actions

Scan the QR code to install the App and get 2 free unlocks

Unlock quizzes for free by uploading documents