Multiple Choice
The graph of a company's total cost function is shown. Does this total cost function represent a manufacturing process that is getting more efficient or less efficient as the production level increases? 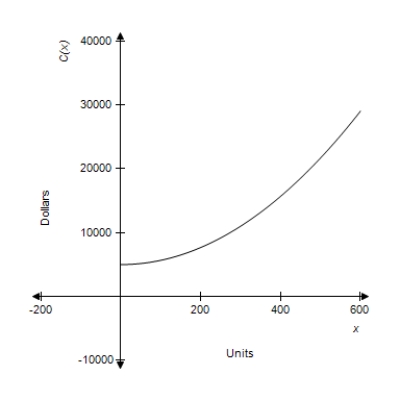
A) less efficient
B) more efficient
Correct Answer:
Verified
Related Questions
Q216: Identify x-values where Q217: Find the indicated derivative. Q218: Find the third derivative. Unlock this Answer For Free Now! View this answer and more for free by performing one of the following actions Scan the QR code to install the App and get 2 free unlocks Unlock quizzes for free by uploading documents![]()


