The following table shows the numbers of U.S. cellular subscriberships (in millions) from 1985 to 2002. 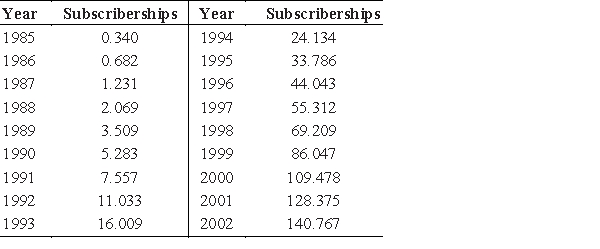 Source: The CTIA Semi-Annual Wireless Industry Survey
Assume that the number of U.S. cellular subscriberships, in millions, can be modeled by the function 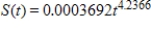 , where t is the number of years past 1980. Use the second derivative to estimate how fast the rate of increase in subscriberships was changing in 1991 in millions of subscriberships per year.
A) 121.08
B) -121.08
C) 1.08
D) -1.08
E) 0
Correct Answer:
Verified
Q226: The graph of a company's total cost
Q227: Total revenue is in dollars and x
Q228: In this problem, cost, revenue, and profit
Q229: In this problem, cost, revenue, and profit
Q230: The following table shows the numbers of
Q232: If the cost function for a commodity
Q233: Total revenue is in dollars and x
Q234: Total revenue is in dollars and x
Q235: In this problem, cost, revenue, and profit
Q236: The graph of a company's total cost
Unlock this Answer For Free Now!
View this answer and more for free by performing one of the following actions

Scan the QR code to install the App and get 2 free unlocks

Unlock quizzes for free by uploading documents