Suppose that for selected years from 1970 to 2006, the following table shows the percent of total U.S. workers who are female. 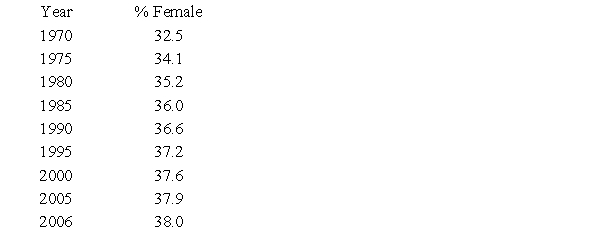
Assume these data can be modeled with the function 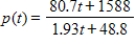 where p(t) is the percent of the U.S. workforce that is female and t is the number of years past 1970. Find the function that models the instantaneous rate of change of the percent of U.S. workers who are female.
A) 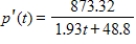
B) 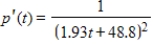
C) 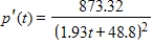
D) 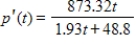
E) 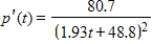
Correct Answer:
Verified
Q149: Differentiate the function Q150: Suppose the lowest temperature recorded in Indianapolis, Q151: Use the numerical derivative feature of a Q152: Differentiate the given function. Q153: Differentiate the given function. Q155: Differentiate the given function. Q156: For the given function, find the instantaneous Q157: Suppose the revenue (in dollars) from the Q158: For the given function, find the slope Q159: Suppose that for selected years from 1970![]()

Unlock this Answer For Free Now!
View this answer and more for free by performing one of the following actions

Scan the QR code to install the App and get 2 free unlocks

Unlock quizzes for free by uploading documents