The following figure shows a graph that compares the present values of two ordinary annuities of $800 quarterly as functions of the number of quarters. One annuity is at an annual rate of 6% compounded quarterly, and the other is at an annual rate of 9% compounded quarterly. Use the graph below to estimate the difference between the present values of these annuities for 25 years (100 quarters) . 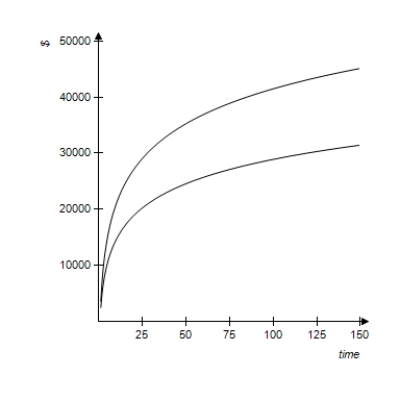
A) $32,000
B) $4,500
C) $30,000
D) $100
E) $9,586
Correct Answer:
Verified
Q78: Find An: Q79: A couple has determined that they need Q80: State whether the problem relates to an Q81: A retiree inherits $87,000 and invests it Q82: A young couple wants to have a Q84: An annuity consists of payments of $400 Q85: Decide whether the problem relates to an Q86: A professional athlete invested $3.1 million of Q87: Suppose Becky has her choice of $10,000 Q88: Suppose Becky has her choice of $20,000![]()
Unlock this Answer For Free Now!
View this answer and more for free by performing one of the following actions

Scan the QR code to install the App and get 2 free unlocks

Unlock quizzes for free by uploading documents