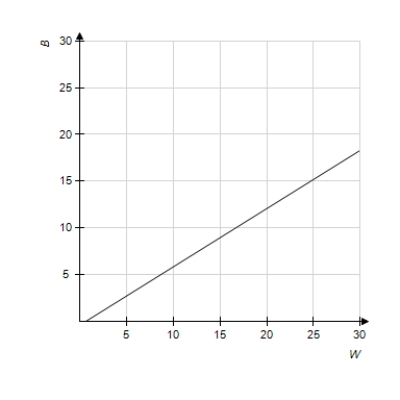
With U.S. Census Bureau data, the model that relates the per capita annual income (in thousands of dollars) of blacks B and whites W was found to be  . Use a graphing utility to graph this equation for the range
  ,
,  ;
;  ,
,  . Is the image below the correct graph of the function?
A) yes
B) no
Correct Answer:
Verified
Q172: The number (in millions) of U.S. cellular
Q173: Solve the system by elimination, or by
Q174: Solve the system of equations by using
Q175: Solve the system of equations by substitution.
Q176: The graphs of the two equations below
Q178: The Millcreek watershed area was heavily strip-mined
Q179: Use the x-intercept method to find the
Q180: The number of millions of short tons
Q181: Use the left-to-right elimination method to solve
Q182: Use the left-to-right elimination method to solve
Unlock this Answer For Free Now!
View this answer and more for free by performing one of the following actions

Scan the QR code to install the App and get 2 free unlocks

Unlock quizzes for free by uploading documents