Consider the clustered bar chart of the dashboard developed to monitor the performance of a call center: 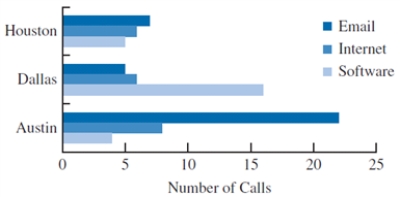 This chart allows the IT manager to
A) identify how often a problem is related to hardware.
B) identify the frequency of a particular type of problem by location.
C) identify which city contains the most customers.
D) identify the percent of customers who do not have one of the listed problems.
Correct Answer:
Verified
Q30: A PivotChart, in few instances, is the
Q31: This Excel bar chart displays the demographics
Q32: An effective display of trend and magnitude
Q33: A _ is useful for visualizing hierarchical
Q34: _ merges maps and statistics to present
Q36: A _ is used for examining data
Q37: The best way to differentiate chart elements
Q38: A two-dimensional graph representing the data using
Q39: An alternative for a stacked column chart
Q40: This bar chart displays the demographics of
Unlock this Answer For Free Now!
View this answer and more for free by performing one of the following actions

Scan the QR code to install the App and get 2 free unlocks

Unlock quizzes for free by uploading documents