The following data shows the price of PAO, Inc. stock over the last 8 months. 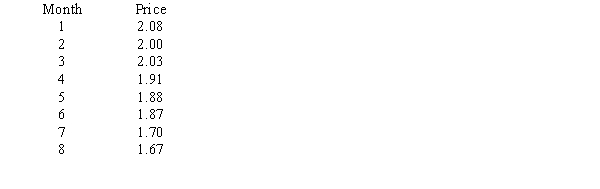
a.Develop a scatter diagram and draw a trend line through the points.
b.What kind of relationship exists between stock price and time (negative, positive, or no relation)?
Correct Answer:
Verified
Q40: Exhibit 2-3
A survey of 800 college seniors
Q41: The frequency distribution below was constructed from
Q42: Exhibit 2-4
Michael's Compute-All, a national computer retailer,
Q43: Thirty students in the School of Business
Q44: Below you are given the examination scores
Q46: Five hundred recent graduates indicated their majors
Q47: For the following observations, plot a scatter
Q48: Exhibit 2-4
Michael's Compute-All, a national computer retailer,
Q49: The frequency distribution below was constructed from
Q50: Exhibit 2-4
Michael's Compute-All, a national computer retailer,
Unlock this Answer For Free Now!
View this answer and more for free by performing one of the following actions

Scan the QR code to install the App and get 2 free unlocks

Unlock quizzes for free by uploading documents