Exhibit 3-1
The following data show the number of hours worked by 200 statistics students. 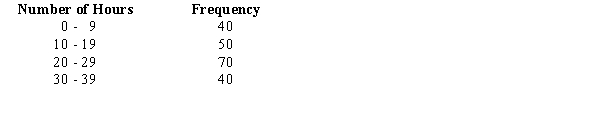
-Refer to Exhibit 3-1. The cumulative relative frequency for the class of 10 - 19
A) is 90
B) is .25
C) is .45
D) cannot be determined from the information given
Correct Answer:
Verified
Q63: From a population of size 500, a
Q87: The standard deviation of a sample was
Q88: The variance of a sample was reported
Q89: Exhibit 3-2
A researcher has collected the following
Q91: The geometric mean of 1, 1, 8
Q93: The geometric mean of 1, 3, 5,
Q94: Exhibit 3-3
A researcher has collected the following
Q95: Exhibit 3-2
A researcher has collected the following
Q96: Exhibit 3-2
A researcher has collected the following
Q97: The geometric mean of 1, 2, 4,
Unlock this Answer For Free Now!
View this answer and more for free by performing one of the following actions

Scan the QR code to install the App and get 2 free unlocks

Unlock quizzes for free by uploading documents