Exhibit 3-1
The following data show the number of hours worked by 200 statistics students. 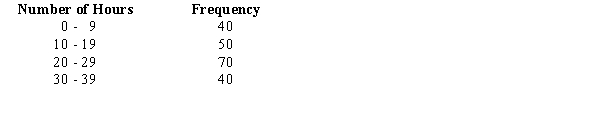
-Refer to Exhibit 3-1. The relative frequency of students working 9 hours or less
A) is .2
B) is .45
C) is 40
D) cannot be determined from the information given
Correct Answer:
Verified
Q63: From a population of size 500, a
Q75: From a population of size 1,000, a
Q81: From a population of size 400, a
Q82: Exhibit 3-3
A researcher has collected the following
Q83: Exhibit 3-3
A researcher has collected the following
Q85: Exhibit 3-1
The following data show the number
Q87: The standard deviation of a sample was
Q88: The variance of a sample was reported
Q89: Exhibit 3-2
A researcher has collected the following
Q91: The geometric mean of 1, 1, 8
Unlock this Answer For Free Now!
View this answer and more for free by performing one of the following actions

Scan the QR code to install the App and get 2 free unlocks

Unlock quizzes for free by uploading documents