Shown below is a portion of a computer output for a regression analysis relating supply (Y in thousands of units) and unit price (X in thousands of dollars). 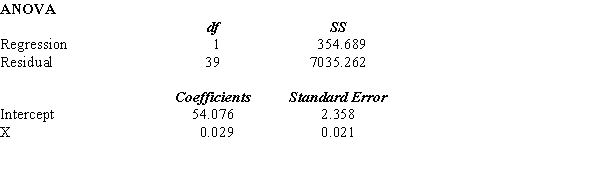
a. What has been the sample size for this problem?
b. Perform a t test and determine whether or not supply and unit price are related. Let = 0.05.
c. Perform and F test and determine whether or not supply and unit price are related. Let = 0.05.
d. Compute the coefficient of determination and fully interpret its meaning. Be very specific.e. Compute the coefficient of correlation and explain the relationship between supply and unit price.f. Predict the supply (in units) when the unit price is $50,000.
Correct Answer:
Verified
View Answer
Unlock this answer now
Get Access to more Verified Answers free of charge
Q122: Researchers have collected data on the hours
Q123: The owner of a retail store randomly
Q124: Given below are five observations collected
Q125: Given below are four observations collected
Q126: An automobile dealer wants to see if
Q128: Below you are given a partial
Q129: Below you are given information on
Q130: The following data represent a company's
Q131: Below you are given a partial
Q132: Shown below is a portion of
Unlock this Answer For Free Now!
View this answer and more for free by performing one of the following actions

Scan the QR code to install the App and get 2 free unlocks

Unlock quizzes for free by uploading documents