Monthly total production costs and the number of units produced at a local company over a period of 10 months are shown below. 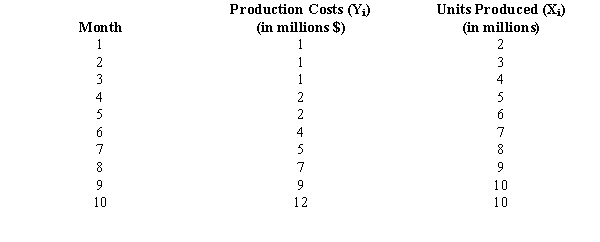
a.Draw a scatter diagram for the above data.
b.Assume that a model in the form of  best describes the relationship between X and Y. Estimate the parameters of this curvilinear regression equation.
Correct Answer:
Verified
View Answer
Unlock this answer now
Get Access to more Verified Answers free of charge
Q43: Part of an Excel output relating Y
Q44: Exhibit 16-4
In a laboratory experiment, data were
Q45: We want to test whether or not
Q46: Exhibit 16-4
In a laboratory experiment, data were
Q47: We are interested in determining what
Q49: A researcher is trying to decide whether
Q50: Multiple regression analysis was used to
Q51: Exhibit 16-4
In a laboratory experiment, data were
Q52: In a regression analysis involving 21 observations
Q53: Exhibit 16-4
In a laboratory experiment, data were
Unlock this Answer For Free Now!
View this answer and more for free by performing one of the following actions

Scan the QR code to install the App and get 2 free unlocks

Unlock quizzes for free by uploading documents