The information below represents the relationship between the selling price (Y, in $1000) of a home, the square footage of the home (  ), and the number of bedrooms in the home (
  ). The data represents 65 homes sold in a particular area of a city and was analyzed using simple linear regression for each independent variable.
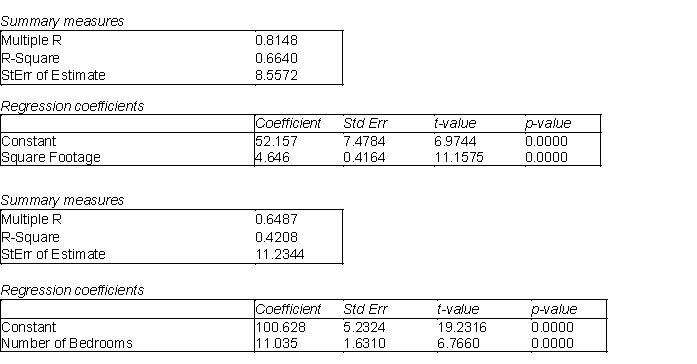
-(A) Is there evidence of a linear relationship between the selling price and the square footage of the homes? If so, interpret the least squares line and characterize the relationship (i.e., positive, negative, strong, weak, etc.).
(B) Identify and interpret the coefficient of determination (  ) for the model in (A).
(C) Identify and interpret the standard error of estimate  for the model in (A).
(D) Is there evidence of a linear relationship between the selling price and number of bedrooms of the homes? If so, interpret the least squares line and characterize the relationship (i.e., positive, negative, strong, weak, etc.).
(E) Identify and interpret the coefficient of determination (  ) for the model in (D).
(F) Identify and interpret the standard error of the estimate (  ) for the model in (C).
(G) Which of the two variables, the square footage or the number of bedrooms, is the relationship with home selling price stronger? Justify your choice.
Correct Answer:
Verified
View Answer
Unlock this answer now
Get Access to more Verified Answers free of charge
Q82: An express delivery service company recently conducted
Q83: Adjustors working for a large insurance agency
Q84: The human resource manager at Gamma, Inc.
Q85: The station manager of a local television
Q86: La Cabaña, a popular motel chain in
Q88: An automobile rental company wants to predict
Q89: The marketing manager of a large supermarket
Q90: A large auto dealership is interested in
Q91: A constant elasticity, or multiplicative, model the
Q92: A new online auction site specializes in
Unlock this Answer For Free Now!
View this answer and more for free by performing one of the following actions

Scan the QR code to install the App and get 2 free unlocks

Unlock quizzes for free by uploading documents