TABLE 2- 3
Every spring semester, the School of Business coordinates a luncheon with local business leaders for graduating seniors, their families, and their friends. Corporate sponsorship pays for the lunches of each of the seniors, but students have to purchase tickets to cover the cost of lunches served to guests they bring with them. The following histogram represents the attendance at the senior luncheon, where X is the number of guests each student invited to the luncheon and f is the number of students in each category.
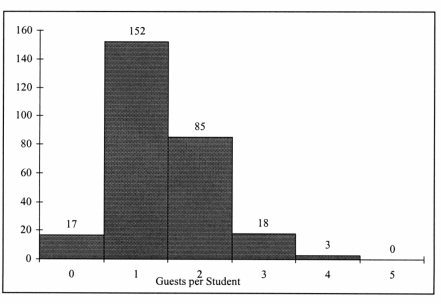
-Referring to the histogram from Table 2-3, if all the tickets purchased were used, how many guests attended the luncheon?
A) 275
B) 388
C) 4
D) 152
Correct Answer:
Verified
Q18: When constructing charts, the following is plotted
Q19: TABLE 2-6
A sample of 200 students
Q20: TABLE 2-15
The figure below is the ogive
Q21: A type of vertical bar chart in
Q22: You have collected data on the approximate
Q24: When studying the simultaneous responses to two
Q25: TABLE 2-6
A sample of 200 students
Q26: TABLE 2-4
A survey was conducted to
Q27: TABLE 2-6
A sample of 200 students
Q28: Data on 1,500 students' height were collected
Unlock this Answer For Free Now!
View this answer and more for free by performing one of the following actions

Scan the QR code to install the App and get 2 free unlocks

Unlock quizzes for free by uploading documents