There were approximately 28 million unemployed workers in the United States.The circle graph shows the age profile of these unemployed workers.What is the probability that a person selected at random from the population of unemployed workers is in the 45-64 age group.( and ) 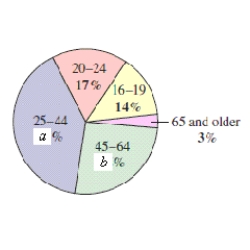
A)
B)
C)
D) 38
E)
Correct Answer:
Verified
Q1: Find the probability for the experiment
Q2: You are given the probability that
Q3: You are given the probability that
Q4: Find the probability for the experiment
Q6: You are given the probability that
Q7: Find the probability for the experiment
Q8: There were approximately 8.92 million unemployed
Q8: Determine the sample space for the experiment.
Q10: You are given the probability that
Q11: Find the probability for the experiment
Unlock this Answer For Free Now!
View this answer and more for free by performing one of the following actions

Scan the QR code to install the App and get 2 free unlocks

Unlock quizzes for free by uploading documents