Use a graphing utility to graph the inequalities.Shade the region representing the solution set of the system.
A) 10 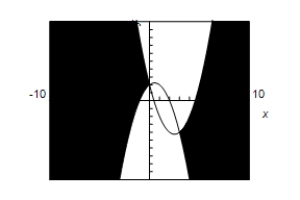 -10
-10
B) 10 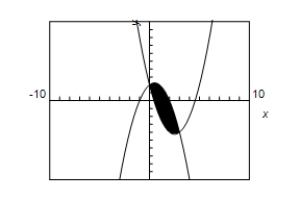 -10
-10
C) 10 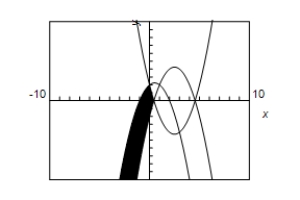 -10
-10
D) 10 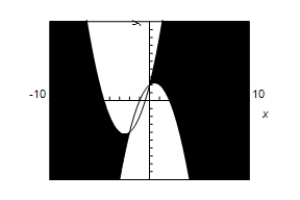 -10
-10
E) 10 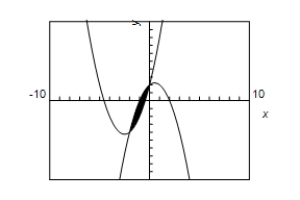 -10
-10
Correct Answer:
Verified
Q82: Use a graphing utility to graph
Q83: Sketch the graph and label the
Q84: For the given supply and demand
Q85: Derive a set of inequalities to
Q86: Write an inequality for the shaded
Q88: A person plans to invest up
Q89: Derive a set of inequalities
Q90: Determine which one of the ordered
Q91: Sketch the graph of the inequality.
Q92: For a concert event, there are
Unlock this Answer For Free Now!
View this answer and more for free by performing one of the following actions

Scan the QR code to install the App and get 2 free unlocks

Unlock quizzes for free by uploading documents