Refer to the following graph:
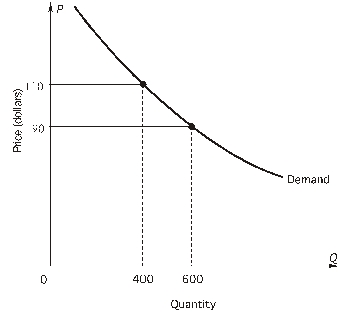
-Suppose price rises from $90 to $110. Using representative arrows, the quantity effect is a relatively ________ (short, long) arrow pointing _______ (upward, downward) .
A) short; upward
B) short; downward
C) long; upward
D) long; downward
Correct Answer:
Verified
Q37: Refer to the following table showing
Q38: Refer to the following table showing
Q39: Refer to the following table showing
Q40: Use the figure below to calculate the
Q43: Refer to the following graph:

Q44:
"When the British government tripled university
Q46: If a drought increases the price of
Q47: Refer to the following graph:
Q48: Perfume industry statistics show that over the
Q51: Demand is (more elastic / less elastic)in
Unlock this Answer For Free Now!
View this answer and more for free by performing one of the following actions

Scan the QR code to install the App and get 2 free unlocks

Unlock quizzes for free by uploading documents