Use the following figure to answer the question.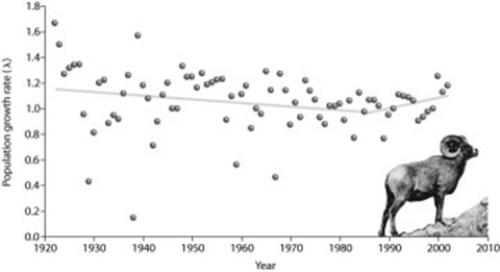
According to the figure, what is the most accurate explanation for the data after 1985?
A) emigration
B) immigration
C) introduction of new alleles into the population
D) increased resources in the area
Correct Answer:
Verified
Q19: Tropical forests are being converted to farm
Q20: The human impact that scientists determined has
Q21: A land developer and several ecologists are
Q22: Use the following figure to answer the
Q23: Use the following figure to answer the
Q26: Which of the following is a generally
Q27: The primary difference between the small-population approach
Q28: Use the following figure to answer the
Q32: If the sex ratio in a population
Q37: Which of the following factors could cause
Unlock this Answer For Free Now!
View this answer and more for free by performing one of the following actions

Scan the QR code to install the App and get 2 free unlocks

Unlock quizzes for free by uploading documents