Use the graph to answer the following question.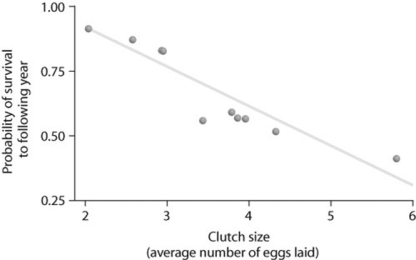
Looking at the data in the figure, what can be said about survival and clutch size?
A) Animals with low survival tend to have smaller clutch sizes.
B) Large clutch size correlates with low survival.
C) Animals with high survival tend to have medium-sized clutches.
D) Probability of survivorship does not correlate with clutch size.
Correct Answer:
Verified
Q34: Which of the following graphs illustrates the
Q35: Which of the following graphs best illustrates
Q36: As N approaches K for a certain
Q37: A population of ground squirrels has an
Q38: Use the graph to answer the following
Q40: Imagine that you are managing a large
Q41: Use the graphs to answer the following
Q42: Which of the following traits is characteristic
Q43: Often the growth cycle of one population
Q44: Which of the following graphs illustrates the
Unlock this Answer For Free Now!
View this answer and more for free by performing one of the following actions

Scan the QR code to install the App and get 2 free unlocks

Unlock quizzes for free by uploading documents