Use the figure to answer the following question.
Life Table for Zootoca vivipara in the Netherlands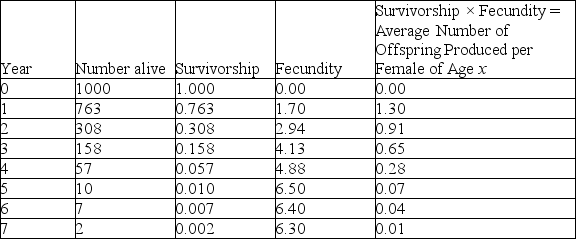
Data are from Strijbosch and Creemers, 1988.
Using the table, determine which age class year would cause the largest decline in the resulting population growth, if it were wiped out by disease.
A) age class year 1
B) age class year 2
C) age class year 3
D) age class year 4
Correct Answer:
Verified
Q1: Uniform spacing patterns in plants such as
Q2: Use the survivorship curves in the figure
Q4: To measure the population of lake trout
Q5: Which of the following is the best
Q6: Use the graph to answer the following
Q7: Long-term studies of Belding's ground squirrels show
Q8: An ecologist recorded 12 white-tailed deer, Odocoileus
Q9: Which of the following assumptions must be
Q10: Suppose researchers marked 800 turtles and later
Q11: Use the figure to answer the following
Unlock this Answer For Free Now!
View this answer and more for free by performing one of the following actions

Scan the QR code to install the App and get 2 free unlocks

Unlock quizzes for free by uploading documents