Use the following to answer question
The scatterplot, created from 1995 U.S.News & World Report data on approximately 1,300 U.S.colleges and universities, depicts the relation between the student-faculty ratio at the school and the number of admissions applications the school received.
Figure: Student-Faculty Ratio 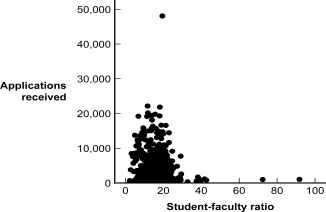
-(Figure: Student-Faculty Ratio) Based on the scatterplot, what is the relation between an institution's student-faculty ratio and the number of applications it receives?
A) perfect positive
B) positive
C) negative
D) no relation
Correct Answer:
Verified
Q33: According to guidelines published by Cohen (1988),
Q34: The results of a study find a
Q35: Why do correlation coefficients greater than 0.50
Q36: Researchers who study the process of reading
Q37: Which of these values of the correlation
Q39: Which of these values of the correlation
Q40: The correlation coefficient between class attendance and
Q41: One assumption for using hypothesis testing for
Q42: A _ is a graphical representation of
Q43: What is the null hypothesis when
Unlock this Answer For Free Now!
View this answer and more for free by performing one of the following actions

Scan the QR code to install the App and get 2 free unlocks

Unlock quizzes for free by uploading documents