Use the following to answer questions
The scatterplot and regression line on the left depict the relation between a state's expenditure per student and the average SAT scores for students in the state.The scatterplot and regression line on the right depict the relation between students' SAT Verbal and SAT Quantitative scores.
Figure: Standard Error Comparisons 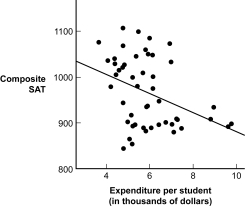
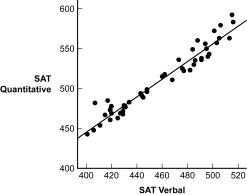
-(Figure: Standard Error Comparisons) For which prediction is the standard error of the estimate greater?
A) state expenditure per student from composite SAT scores
B) composite SAT scores from the state's expenditure per student
C) SAT Quantitative scores from SAT Verbal scores
D) SAT Verbal scores from SAT Quantitative scores
Correct Answer:
Verified
Q21: A high standard error of the estimate
Q22: If the standard error of the estimate
Q23: The standardized regression coefficient expresses the:
A) relation
Q24: The standard error of estimate could be
Q25: A simple way to calculate proportionate reduction
Q27: Which statistic quantifies the improvement in ability
Q28: Every year it seems as though last
Q29: The proportionate reduction in error is a
Q30: The standardized regression coefficient expresses a predicted
Q31: For a simple linear regression, the standardized
Unlock this Answer For Free Now!
View this answer and more for free by performing one of the following actions

Scan the QR code to install the App and get 2 free unlocks

Unlock quizzes for free by uploading documents