Use the following to answer questions
This table and figure depict the average SAT scores for entering freshmen in the year 1995 at 36 North Carolina colleges.
Figure: Histogram of SAT 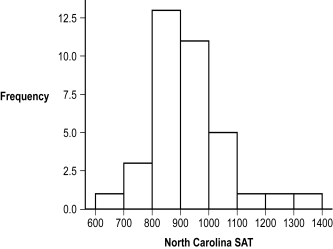
-(Figure: Histogram of SAT) What seems to be the shape of the distribution represented in this histogram?
A) symmetrical
B) positively skewed
C) rectangle
D) negatively skewed
Correct Answer:
Verified
Q30: In a frequency polygon, the x-axis represents
Q31: Use the following to answer questions
This
Q32: Katrina observes and records the number of
Q33: Use the following to answer questions
This
Q34: A positive skew may have a tail
Q36: A frequency polygon is similar to a
Q37: A negative skew may have a tail
Q38: Professor Kellogg calculates the grades on the
Q39: Use the following to answer question
This
Q40: Use the following to answer questions
This
Unlock this Answer For Free Now!
View this answer and more for free by performing one of the following actions

Scan the QR code to install the App and get 2 free unlocks

Unlock quizzes for free by uploading documents