The following question refers to the figure.
In this eight-year experiment, 12 populations of E. coli, each begun from a single cell, were grown in low-glucose conditions for 20,000 generations. Each culture was introduced to fresh growth medium every 24 hours. Occasionally, samples were removed from the populations, and their fitness in low-glucose conditions was tested against that of members sampled from the ancestral (common ancestor) E. coli population.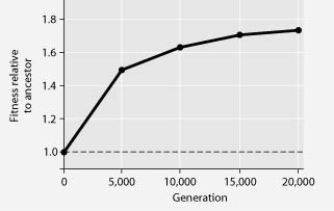
Imagine that after generation 20,000, the experimental cells were grown in high-glucose conditions for 20,000 generations (using the same transfer process described) . Refer to the y-axis on the graph and predict the fitness of the new lines when tested in low- and high-glucose conditions.
A) low: 1.0; high: 1.0
B) low: 1.6; high: 1.6
C) low: 1.0; high: 1.6
D) low: 1.6; high: 1.0
Correct Answer:
Verified
Q4: The following table depicts characteristics of five
Q5: Use the information in the following paragraph
Q6: In a bacterium that possesses antibiotic resistance
Q7: Jams, jellies, preserves, honey, and other foods
Q8: Use the information in the following paragraph
Q10: If a bacterium regenerates from an endospore
Q11: The predatory bacterium Bdellovibrio bacteriophorus drills into
Q12: Use the following information and graph to
Q13: Use the following information and graph to
Q14: Use the following information and graph to
Unlock this Answer For Free Now!
View this answer and more for free by performing one of the following actions

Scan the QR code to install the App and get 2 free unlocks

Unlock quizzes for free by uploading documents