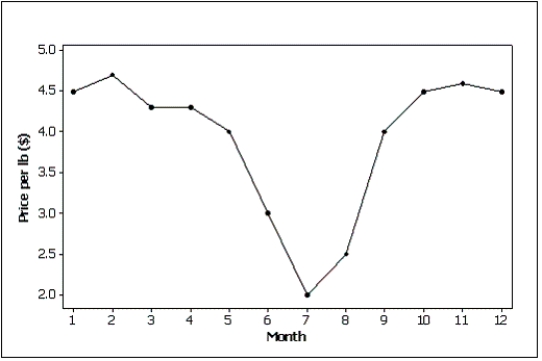
Beef prices throughout the year (month 1 = January) are shown in the line chart below (per pound).Describe beef prices for this given year using this line chart. 
Correct Answer:
Verified
View Answer
Unlock this answer now
Get Access to more Verified Answers free of charge
Q64: A(n)_ is created by plotting the value
Q74: Observations that are taken during successive points
Q87: In order to draw a scatter diagram,we
Q92: When two variables are linearly related,and tend
Q100: The two most important characteristics to examine
Q105: When one variable increases and the other
Q112: A professor examines the relationship between minutes
Q118: The first scatter diagram below shows a
Q118: One of the variables used to help
Q119: The scatter diagram below depicts data with
Unlock this Answer For Free Now!
View this answer and more for free by performing one of the following actions

Scan the QR code to install the App and get 2 free unlocks

Unlock quizzes for free by uploading documents