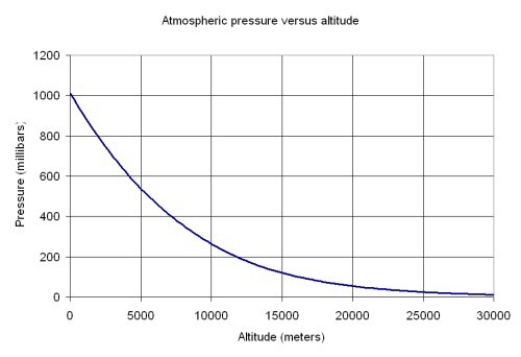
The graph below shows the atmospheric pressure P, in millibars of mercury, as a function of altitude A in meters.According to the graph, what is the approximate value of the solution for A of the equation  ?
? 
A)  meters
B)  meters
C)  meters.
D) The equation has no solution.
Correct Answer:
Verified
Q17: Below is a graph of a function
Q18: Choose the answer that best completes the
Q19: The graph of a function that is
Q20: Below is a graph of a function
Q21: The graph below shows the numbers, in
Q23: Which of the following stories best fits
Q24: Which of the following stories best fits
Q25: The graph below shows the fundraising
Q26: The graph below shows the value, in
Q27: Which of the following stories best fits
Unlock this Answer For Free Now!
View this answer and more for free by performing one of the following actions

Scan the QR code to install the App and get 2 free unlocks

Unlock quizzes for free by uploading documents