A function shows constant percentage decay.Which of the following may be the graph of this function?
A) 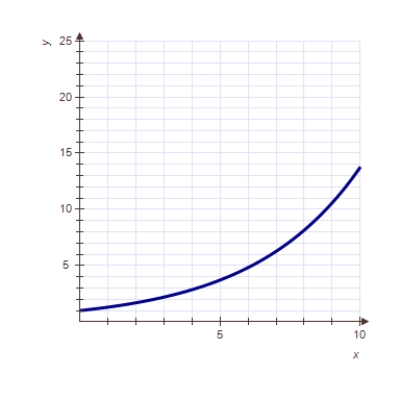
B) 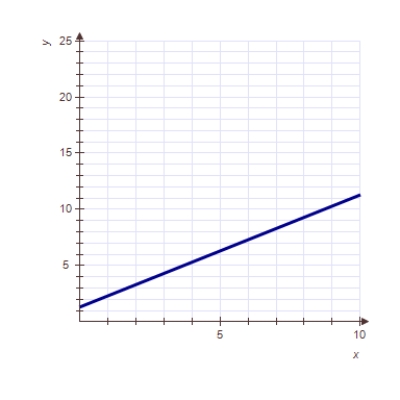
C) 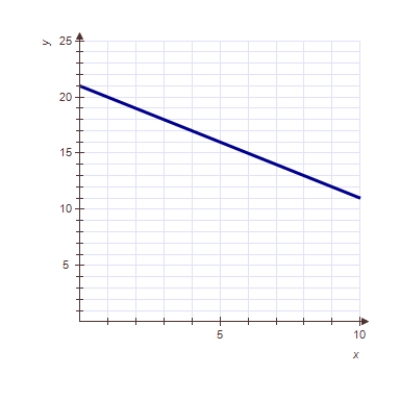
D) 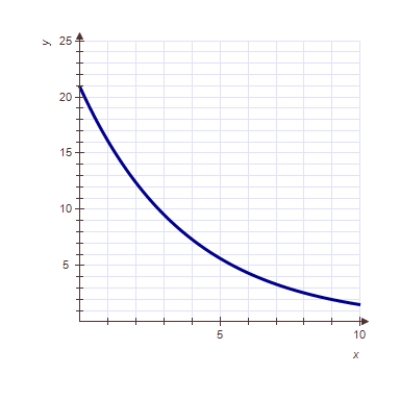
Correct Answer:
Verified
Q21: The formula for an exponential function is
Q22: A radioactive substance is decaying at a
Q23: The initial value of one function is
Q24: The half-life of a certain radioactive substance
Q25: Over a certain period of time, a
Q27: Next year's value of a certain quantity
Q28: A function shows constant percentage growth.Which of
Q29: Next year's value of a certain quantity
Q30: A population is growing at a constant
Q31: The formula for an exponential function is
Unlock this Answer For Free Now!
View this answer and more for free by performing one of the following actions

Scan the QR code to install the App and get 2 free unlocks

Unlock quizzes for free by uploading documents