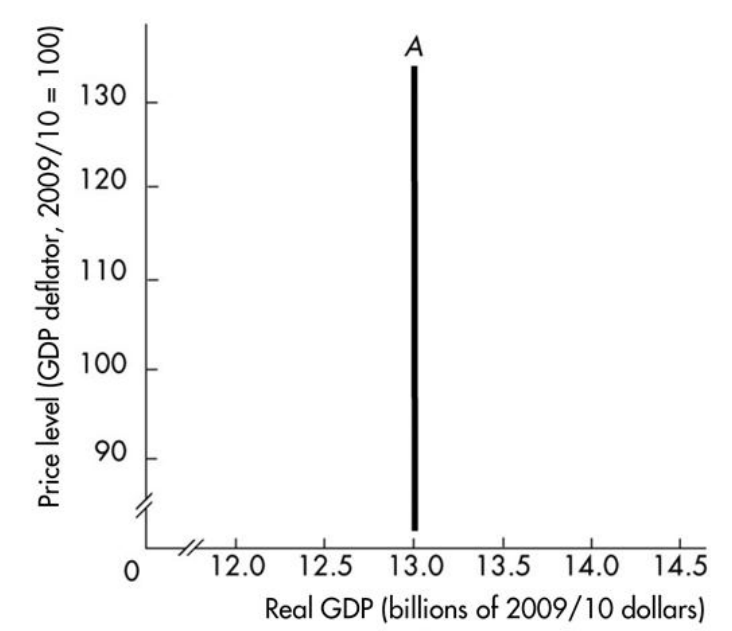
-The curve labelled A in the above figure is a
A) short- run aggregate supply curve.
B) long- run aggregate demand curve.
C) long- run aggregate supply curve.
D) short- run aggregate demand curve.
Correct Answer:
Verified
Q119: The aggregate demand curve shows the _
Q120: According to the wealth effect, if real
Q121: If the money wage and other resource
Q123: When real GDP exceeds potential GDP, then
Q125: The aggregate demand curve shows that, if
Q126: If you have $5,000 in wealth and
Q127: Which of the following does NOT shift
Q128: People expect that the El Nino effect
Q129: The quantity of real GDP demanded equals
Q248: At long- run macroeconomic equilibrium, .
A) real
Unlock this Answer For Free Now!
View this answer and more for free by performing one of the following actions

Scan the QR code to install the App and get 2 free unlocks

Unlock quizzes for free by uploading documents