The table below shows the gender and the percentage of each gender that spent different amounts at a local hardware store. The data was taken from a random sample of single shoppers collected over five consecutive Saturdays at the hardware store. Choose the reason(s) why you cannot do a chi- square test with this data. 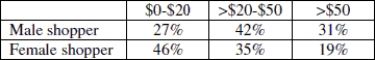
A) The data are from the entire population, not a sample, so inference is unnecessary.
B) There is not enough information to convert the percentages to counts.
C) The samples were not collected randomly.
D) All of these.
Correct Answer:
Verified
Q22: Use the following information to answer the
Q23: Use the following information to answer the
Q24: Suppose a random sample of 1,220 U.S.
Q25: Use the following information to answer the
Q26: Use the following table to answer the
Q28: Suppose a random sample of 1,220 U.S.
Q29: Suppose a researcher was interested in learning
Q30: A health foods store owner is thinking
Q31: Use the following information to answer the
Q32: Use the following information to answer the
Unlock this Answer For Free Now!
View this answer and more for free by performing one of the following actions

Scan the QR code to install the App and get 2 free unlocks

Unlock quizzes for free by uploading documents