Use the following information to answer the question. Below is the scatterplot showing the association between miles driven in a semi truck (x) , and the amount of tread wear on the tires (y) . The residual plot of the data is also shown along with a QQ plot of the residuals.
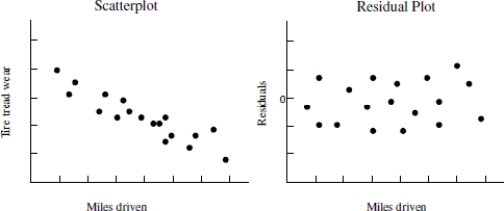
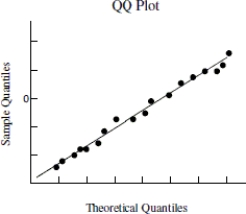
-Based on the plots provided, choose the statement that best describes whether the condition for linearity does or does not hold for the linear regression model.
A) The residual plot does not display a fan shape-- the residual plot is consistent with the claim of linearity.
B) The residual plot shows no trend-- the residual plot is consistent with the claim of linearity.
C) The residual plot shows a horizontal trend-- the residual plot is not consistent with the claim of linearity.
D) The QQ plot mostly follows a straight line trend-- the QQ plot is consistent with the claim of linearity.
Correct Answer:
Verified
Q1: Suppose that you were presented with data
Q2: Use the following information to answer the
Q4: Use the following information to answer the
Q5: The regression output below is the result
Q6: Biologists studying the relationship between the number
Q7: Choose the condition of the linear regression
Q8: Use the following information to answer the
Q9: Which of the following statements is not
Q10: Use the following information to answer the
Q11: Choose the statement(s)that are not true about
Unlock this Answer For Free Now!
View this answer and more for free by performing one of the following actions

Scan the QR code to install the App and get 2 free unlocks

Unlock quizzes for free by uploading documents