The histogram shows the distribution of pitch speeds for a sample of 75 pitches for a college pitcher during one season. Which of the following statements best describes the distribution of the histogram below? 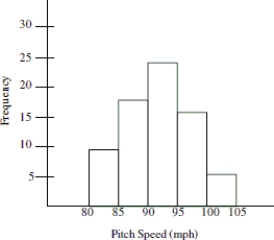
A) The distribution has a large amount of variation which can be seen by comparing the heights of the bars in the histogram.
B) The distribution is left- skewed and shows that most of the pitches were less than 95 mph.
C) The distribution is symmetric around a pitch speed of about 93 mph.
D) The distribution is right- skewed and shows that most of the pitches were more than 90 mph.
Correct Answer:
Verified
Q27: Based on the histogram below, would it
Q28: The distribution of test scores for a
Q29: The distribution of heights of adult females
Q30: Data was collected on hand grip strength
Q31: The histogram below shows the distribution of
Q33: Which of the following statements about bar
Q34: Which of the following statements best describes
Q35: The histogram below shows the distribution of
Q36: The distribution of the numbers of times
Q37: In which category was there more variability
Unlock this Answer For Free Now!
View this answer and more for free by performing one of the following actions

Scan the QR code to install the App and get 2 free unlocks

Unlock quizzes for free by uploading documents