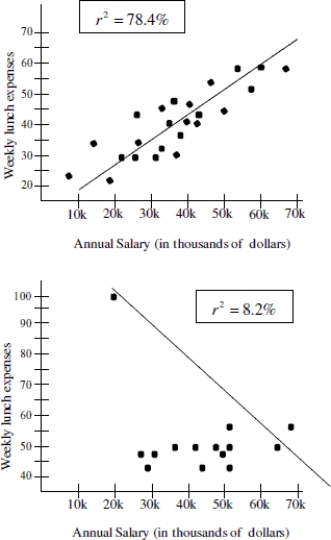
The figures below show the relationship between salary and personal lunch expenses on week days for a group of business men. Comment on the difference in graphs and in the coefficient of determination between the graph that includes a data point of someone who reported earnings of $21,000 per year and weekly personal lunch expenses of $100 per week (second graph)and the graph that did not include this data point (first graph).
Correct Answer:
Verified
View Answer
Unlock this answer now
Get Access to more Verified Answers free of charge
Q50: Use the regression equation to predict how
Q51: A horticulturist conducted an experiment on 120
Q52: Use the following information to answer the
Q53: State the slope and intercept of the
Q54: Suppose that environmentalists monitor algae levels in
Q56: Use the data provided in the table
Q57: The scatterplot below shows the number of
Q58: Suppose that runner height (in inches)and finish
Q59: Suppose that in the Midwest, it is
Q60: Use the data provided in the table
Unlock this Answer For Free Now!
View this answer and more for free by performing one of the following actions

Scan the QR code to install the App and get 2 free unlocks

Unlock quizzes for free by uploading documents