The following graph shows the production possibilities for the economy of Esher: 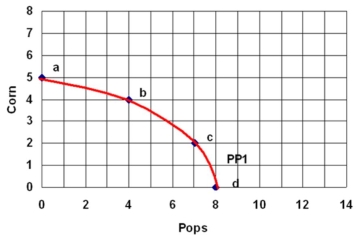 a) What is the total cost of producing 7 pops?
b) What is the total cost of producing 4 corns?
c) What is the cost of moving from point b to point c?
Suppose that Esher experiences a 50% increase in the productivity of producing Pops.
d) Draw in the new production possibilities curve labelled PP2.
e) If Esher wants to have 6 pops, how many corn can it now have?
Correct Answer:
Verified
b) 4 pops
...
View Answer
Unlock this answer now
Get Access to more Verified Answers free of charge
Q29: How does microeconomics differ from macroeconomics?
Q123: Why is economics relevant?
Q134: Define and give an example of the
Q137: Macroeconomics focuses on the outcomes of decisions
Q138: Allocative efficiency is also referred to as
Q140: Discuss the pros and cons of taking
Q145: What is the difference between a factor
Q145: Suppose both Alpha and Beta has
Q146: Using the following information,
Q150: What is the difference between a positive
Unlock this Answer For Free Now!
View this answer and more for free by performing one of the following actions

Scan the QR code to install the App and get 2 free unlocks

Unlock quizzes for free by uploading documents