The figure shows a graph of the power dissipated in a resistor as a function of the resistance. What quantity does the slope of this graph represent? 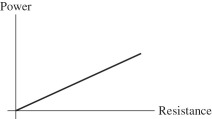
A) the current in the resistor
B) the potential difference across the resistor
C) the reciprocal of the current in the resistor
D) the square of the current in the resistor
E) the resistivity of the resistor
Correct Answer:
Verified
Q21: If the resistance in a constant voltage
Q26: If the voltage across a circuit of
Q35: The length of a certain wire is
Q37: Consider two copper wires of equal cross-sectional
Q39: For the graph shown in the figure,
Q41: For the graph shown in the figure,
Q45: A current of 5.0 A flows
Q51: A 10-A current flows through a wire
Q59: The current through a piece of lab
Q70: A charge of 12 C passes through
Unlock this Answer For Free Now!
View this answer and more for free by performing one of the following actions

Scan the QR code to install the App and get 2 free unlocks

Unlock quizzes for free by uploading documents