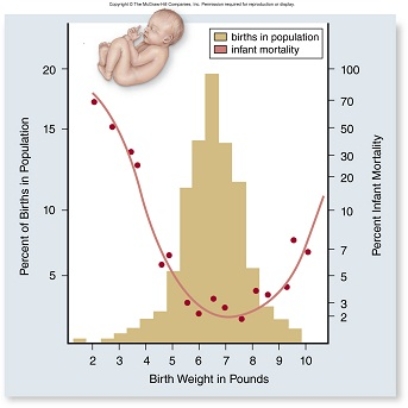
 In the graph above, how can the change in infant mortality be explained as birth weight increases from 2 to 7 pounds?
A) A larger baby will have more developed organs and thus have greater fitness.
B) A baby closer to 7 pounds will have more developed organs and thus have lower mortality.
C) A baby closer to 2 pounds will not be able to be delivered safely and thus have lower mortality.
D) A baby closer to 7 pounds will have more developed organs and thus have higher motality.
Correct Answer:
Verified
Q1: In the Hardy-Weinberg equation, p and q
Q3: The frequency of a particular allele within
Q4: The observation that most pureblood Native Americans
Q5: You spray your kitchen with an insecticide
Q6: "The inheritance of acquired characteristics" proposal was
Q7: Genotypes are said to be in _
Q8: Hardy-Weinberg pointed out that the original proportions
Q9: For a gene with two alternative alleles,
Q10: Natural selection for a certain phenotype will
Q11: Female cardinals select male mates in part
Unlock this Answer For Free Now!
View this answer and more for free by performing one of the following actions

Scan the QR code to install the App and get 2 free unlocks

Unlock quizzes for free by uploading documents